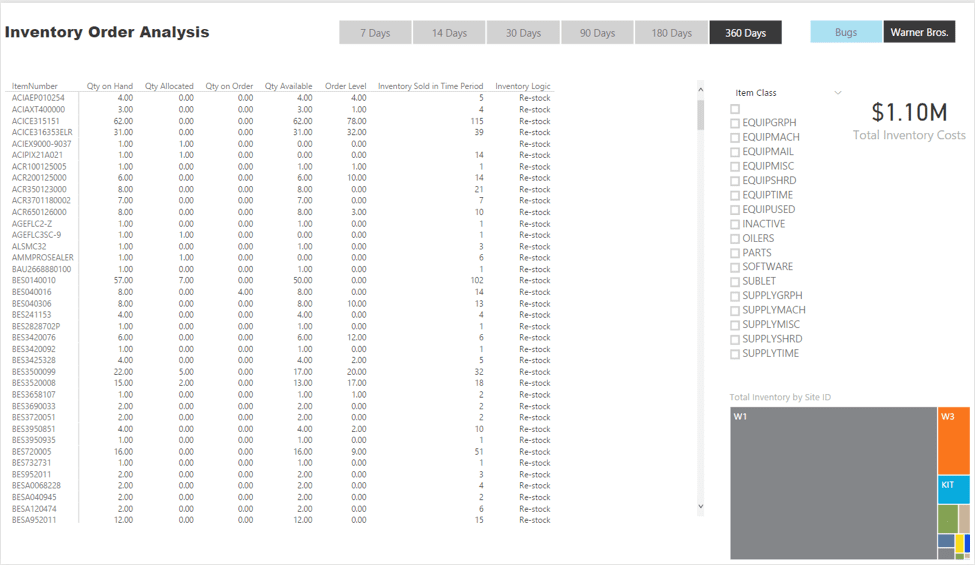
In my original Inventory Reorder Analysis report, I’m using some of the techniques discussed by Belinda Allen in her Inventory Item Reorder Dashboard. I converted hers into Power BI and added a little extra. I then also analyzed the SOP product sales data and computing “Inventory Logic” based on whether the “Inventory Sold in Time Period” columns totaled three times the current “Qty Available” producing a report that looked like the screenshot below.
Enhancing the Inventory Reorder Analysis
A good Inventory Reorder Analysis includes the recalculations to forecast future demand, safety stock, and find your reorder point. For the Sales Quantity Forecasts for my lead time demand, I’m going to use the DAX time series discussed here by Fountain Analytics.
With that in place, I need to calculate our Safety Stock based on the below formula.

Using the data from the Procurement Analysis and the Sales Analysis reports, I calculated the four data points with the below DAX formulas.
Max Days Consumption =
MAXX (
          VALUES ( Dates[Date] ),
            MAXX(
                        VALUES( 'Products'[ItemNumber] ),
                                    'Sales Measures'[Units Sold]
))
Max Days Inventory Lead Time =
MAXX (
            VALUES ( Dates[Date] ),
            MAXX(
                        VALUES( 'Products'[ItemNumber] ),
                                    [Lead Time]
))
Average Days Consumption =
AVERAGEX (
            VALUES ( Dates[Date] ),
            AVERAGEX(
                        VALUES( 'Products'[ItemNumber] ),
                                    'Sales Measures'[Units Sold]
))
Average Days Inventory Lead Time =
AVERAGEX (
            VALUES ( Dates[Date] ),
            AVERAGEX(
                        VALUES( 'Products'[ItemNumber] ),
                                    [Lead Time]
))
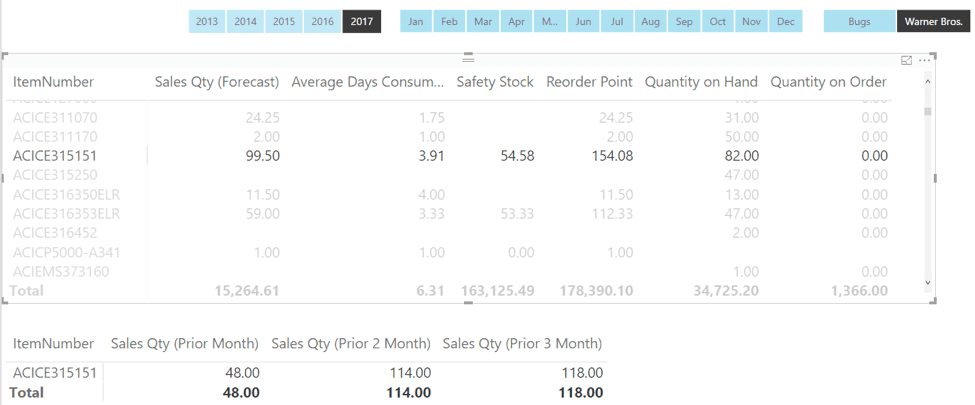
You put it all together to your Reorder Point – (Lead time demand) + (safety stock) = Reorder Point. The end result is the updated Inventory Reorder Analysis report shown below.
Updated Template
You can download the updated template. In the template, I also updated the Inventory Reorder Point report using the New Matrix functionality.
Stay tuned for the future developments of the reports and an overview of their functionality. For help with building reports like this, please contact KTL Solutions at [email url=”info@ktlsolutions.com” class=””]info@ktlsolutions.com[/email] or 301.360.0001
BARRY CROWELL, MBA | BI/EDW Solution Architect
Barry is a Microsoft SQL Certified Professional with a strong knowledge of the Microsoft’s BI Stack (SSIS, SSRS, SSAS and Power BI). He has architected, developed and deployed clients’ Business Intelligence needs using Microsoft’s BI Stack and/or Solver’s BI360. His solutions have included SSIS ETL tools, SSRS reports and dashboards, Excel dashboards, Power BI reports and dashboards, and SSAS cubes. He has performed implementations as the lead consultant and/or end-user project manager. Barry has over 20 years of experience working in accounting and the Microsoft Dynamics GP industry, and in various industries such as housing authorities, universities, Tribal governments, and casino hospitality. He possesses a Bachelor’s Degree in Accounting and Business Administration from Black Hills State University and a Master’s in Business Administration from La Salle University. Barry’s experience in both the IT consultant field and experience as an accountant gives him the ability to understand the issues from both the IT and Finance prospective, and provide a solution that fits the needs for all parties involved.