Written By Barry Crowell
Managing accounts receivable effectively is critical to maintaining strong cash flow, especially in industries with extended payment cycles. This post explores how to combine Power BI and Microsoft Dynamics GP to gain real-time AR insights that drive smarter, proactive decisions.
If you’re using Dynamics GP with the Collections Management add-in, integrating Power BI can transform static data into visual dashboards that empower your AR team to take timely action.
My inspiration for this report came from sqlbi’s Accounts Receivable blog and this Fabric Community post.
Overview of the Report
This Power BI report connects to your Dynamics GP system and incorporates Collections Management data to deliver a centralized, visualized snapshot of AR performance.
Key report features include:
- Accounts Receivable Overview: Overview of current AR Balance, Balance within due date, Balance over the due date, percent of overdue balance and Daily Sales Outstanding (DSO) trends.
- Customer Insights: Customer aggregates on AR Balance, Within Due, Over Due, Over Due %, Open Invoice count, DSO, Overdue buckets, and Credit, Balance and DSO trends by customer.
- Accounts Receivable Details: Easily view AR balances segmented by Within Due Days, 30/60/90/etc. day buckets.
Steps to Implement our Accounts Receivable Report
- Connect Power BI to Dynamics GP
- Using a SQL Server connection, we will access the following GP and Collections Management tables:
- RM20101 – AR Open Transactions
- RM30101 – AR Closed Transactions
- RM00101 – Customer Master
- SOP10100 – Open Sales Transactions
- SOP30200 – Historical Sales Transactions
- CN04001 – Daily Sales Outstanding
- Build or Import the Data Model
- Model relationships between AR tables, customer master, sales transactions, calendar, and collections data. The models relationships should like this when you’re done.
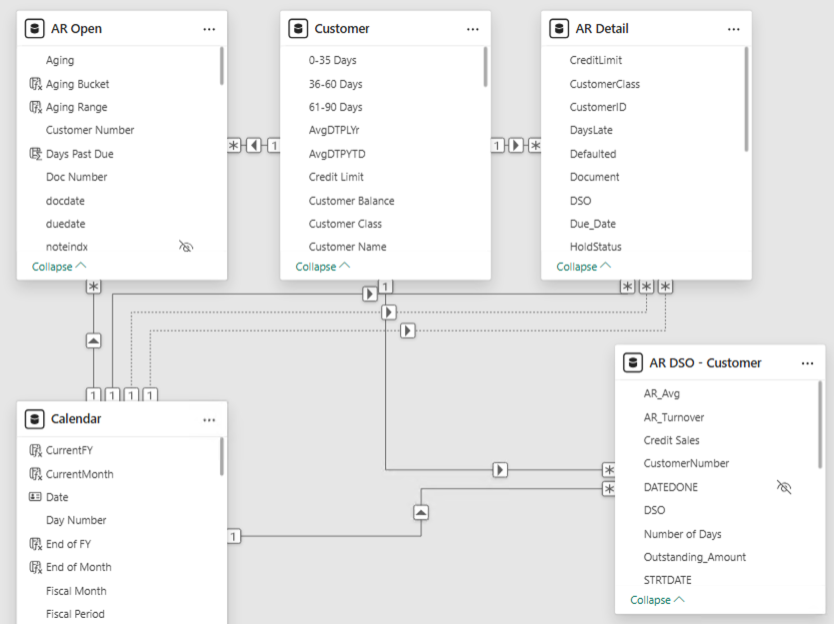
- Add calculated columns such as Days Late, Outstanding Balance, and Payment Status.
3. Design the Report Layout
Accounts Receivable Overview
Create a KPI bar showing AR Balance, Within Due, Overdue %, and Average DSO.
Below it, add visuals for:
- AR bucket analysis by past due date
- Actual vs. estimated cash inflows
- Credit Sales vs. Balance Due trends
- Top 10 Customers by Overdue Amount
Customer Insights
Include a customer filter and visuals for:
- Customers by Overdue Amount
- Credit Sales Trend
- AR Balance Trend
- DSO Trend
Selecting a customer filters all visuals for focused analysis.
Report Benefits
- Proactive Collections: Identify high-risk invoices before they age out.
- Focused Follow-ups: Prioritize collector efforts where they’ll have the most impact.
- Cash Flow Visibility: Instantly understand your AR risk and inflow timing.
Next Steps
In my upcoming Accounts Receivable Power BI blog post, I’ll demonstrate open invoice default predictions that help AR teams prioritize collection efforts.
Need help building a report like this or optimizing your data strategy?
👉 Contact KTL Solutions to turn your data insights into action.